Yet Another ELK Tutorial Part 1
Feb 10, 2016 • Rentaro
Many others have blogged on how to get started with the ELK (Elasticsearch-Logstash-Kibana) log centralization stack. However, despite having read many parts of the documentation I still had issues understanding how it all worked. I go over it in a way that I think would have been helpful for me.
Introduction
ELK is a set of tools that help you get your logs from different applications on different servers all into one dashboard. Elasticsearch stores the logs, Logstash transports the logs, and Kibana shows the logs in a nice dashboard.
Simplest Topology (and Installation)
We're going to install everything locally because it's really helpful to be able to tweak these things locally and see how it behaves. Although you may easily get a demo up and running with docker-compose, it may end up making it much harder to learn how to configure each component.
OSX:
brew install elasticsearch
brew install kibana
brew install logstash
Ubuntu
# create kibana source list
echo "deb http://packages.elastic.co/kibana/4.4/debian stable main" | sudo tee -a /etc/apt/sources.list.d/kibana-4.4.x.list

# add oracle ppa to apt
sudo add-apt-repository -y ppa:webupd8team/java

# create elasticsearch source list
wget -qO - https://packages.elastic.co/GPG-KEY-elasticsearch | sudo apt-key add -
echo "deb http://packages.elastic.co/elasticsearch/2.x/debian stable main" | sudo tee -a /etc/apt/sources.list.d/elasticsearch-2.x.list

# create logstash source list
echo 'deb http://packages.elastic.co/logstash/2.2/debian stable main' | sudo tee /etc/apt/sources.list.d/logstash-2.2.x.list

sudo apt-get -y update
sudo apt-get -y install oracle-java8-installer elasticsearch logstash kibana
Our first topology is the one covered in logstash's documentation, in which logs move from the command line (stdin) directly into Elasticsearch:
stdin -> Logstash -> Elasticsearch -> Kibana
Next start Elasticsearch (Ubuntu: service start elasticsearch, OSX: elasticsearch) and Kibana (Ubuntu: service start kibana, OSX: kibana). Once you do this Kibana should autodiscover Elasticsearch running on the default port. Then, curl localhost:9200 to get some basic info about your Elasticsearch process. You should get something like this:
{
  "status" : 200,
  "name" : "Vermin",
  "cluster_name" : "my_cluster",
  "version" : {
    "number" : "1.6.0",
    "build_hash" : "cdd3ac4dde4f69524ec0a14de3828cb95bbbbbbb",
    "build_timestamp" : "2015-06-09T13:36:34Z",
    "build_snapshot" : false,
    "lucene_version" : "4.10.4"
  },
  "tagline" : "You Know, for Search"
}
Now all that's needed is to use the cluster_name of your cluster to start up Logstash.
logstash -e 'input { stdin { } } output { elasticsearch{ action=>"index" cluster=>"my_cluster"} stdout {} }'
Add log messages to elasticsearch simply by typing stuff into stdin (the terminal) after Logstash startup is completed. Logstash will autodiscover your local instance of elasticsearch and ship the logs to it from stdin.
Logstash startup completed
hello
2016-02-10T20:23:30.660Z a45e60ddc795 hello
world
2016-02-10T20:23:32.036Z a45e60ddc795 world
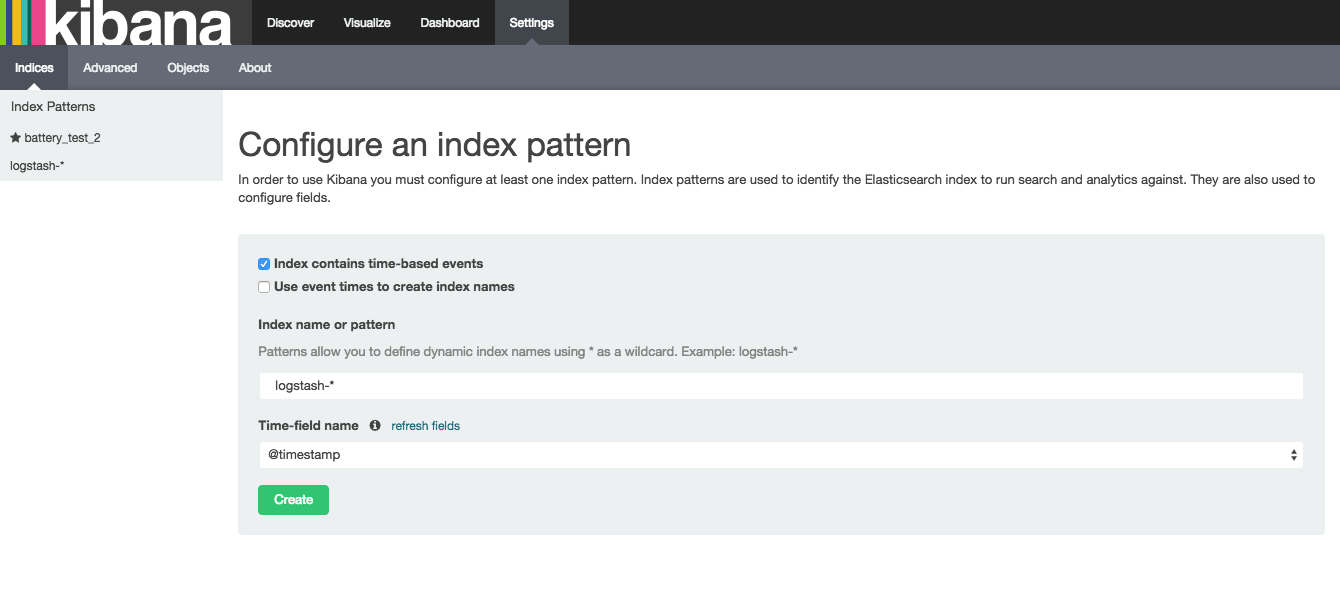
Navigate to kibana (default url: localhost:9200), click the settings tab, and set it up to grab data from index logstash-* and hit 'Create'
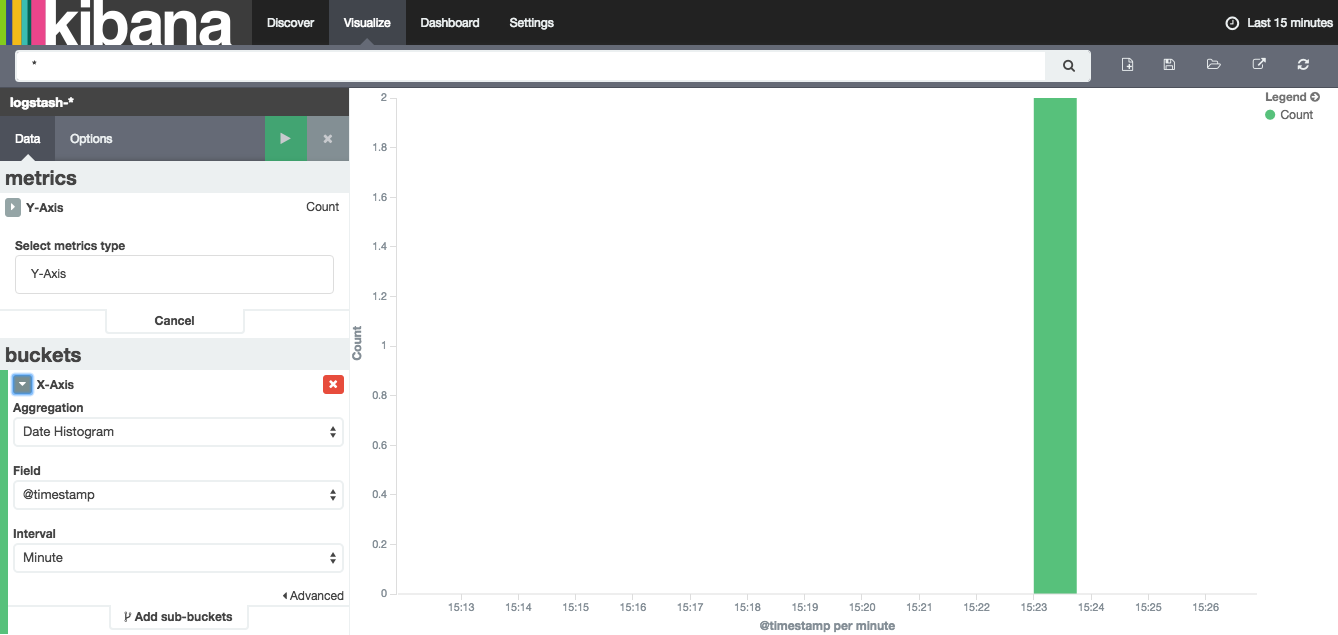
Then Navigate to the Visualize tab and select the bar graph option to create your graph. Below is an example; to replicate simply copy the chart parameters on the left menu and click the green play button.